

April 2026 Signal Day
The Red Line is Negative.

March Closed Below the 200-Day Moving Average
The S&P 500 closed March at 6,528.52 below its 200-day simple moving average of 6,639. The index fell ~5% in March alone, capping a Q1 decline of 4.8%. It's now ~6% off the January all-time high of 6,978.
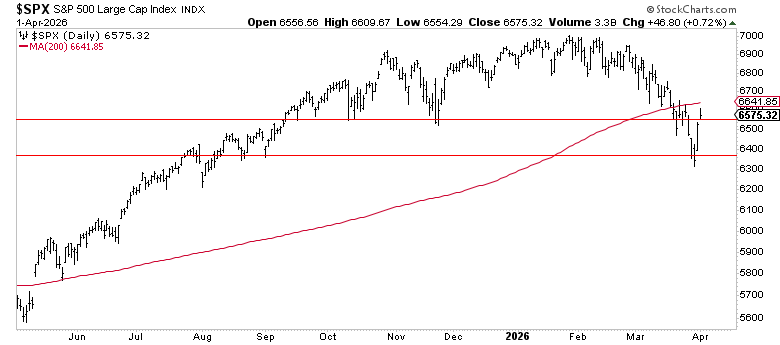
This is a level we track closely. The 200-day SMA is the most widely followed trend indicator in equity markets. A monthly close below it doesn’t happen often, and when it does, it tends to mark either the start of something worse or a washout that resolves higher.
What the Data Says: 23 Instances Since 1990
Since 1990, the S&P 500 has closed a month below its 200-day moving average for the first time in a new regime on 23 occasions. Here’s what happened next:
Nearly 4 out of 5 times, the market is higher 6 and 12 months after the first close below the 200-day. But the exceptions, September 2000, November 2007, coincided with fundamental deterioration and produced drawdowns of 26% and 43% respectively.
Rates, Oil, and the Macro Picture
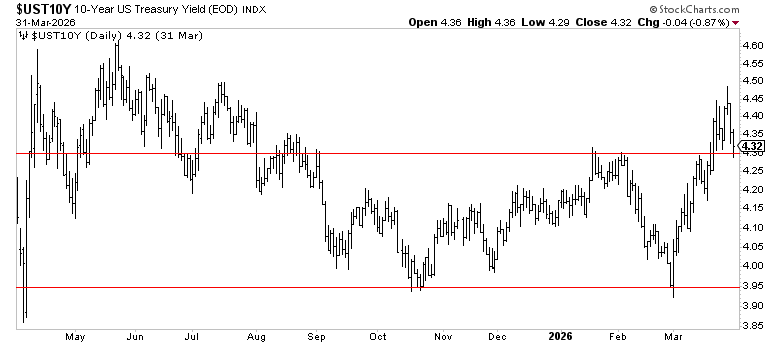
The 10-year Treasury yield sits at 4.32%, holding above its most recent range of 3.95% - 4.3%.
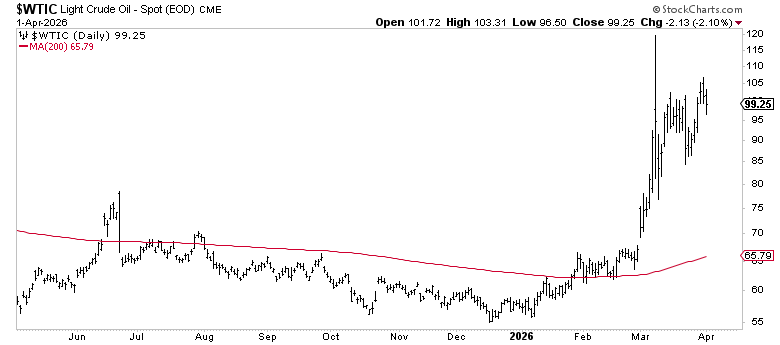
Then there’s oil. WTI crude closed at $99 up over 70% year-to-date. Six months ago it was trading at $55. This isn’t a slow grind higher; it’s a move that’s repricing the entire energy complex and feeding directly into inflation expectations. The Energy sector (XLE) is up over 30% on the year, making it the best-performing sector by a wide margin. Oil above $100 changes the conversation. It pressures margins, complicates the Fed’s path regarding inflation, begging the question - will the fed cut rates?
The Breadth Picture: RSP and XLY:XLP
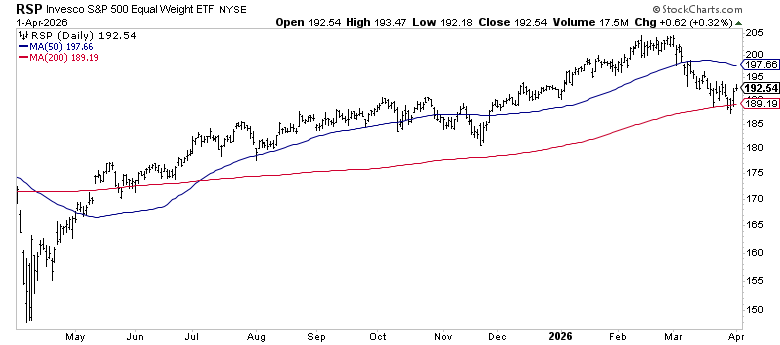
The equal-weight S&P 500 (RSP) is slightly positive on the year at almost +1%. The cap-weighted index is down 3.65%. That 4-point spread tells you the weakness is more-so concentrated in the mega-caps, not the broad market.
More importantly, RSP found support right at its 200-day moving average (189.19) during the March selloff and bounced. It’s now trading at 192.54, back above that level. When the average stock in the index is holding its long-term trend while the cap-weighted index breaks below it, the problem is at the top of the market cap spectrum, not the foundation.
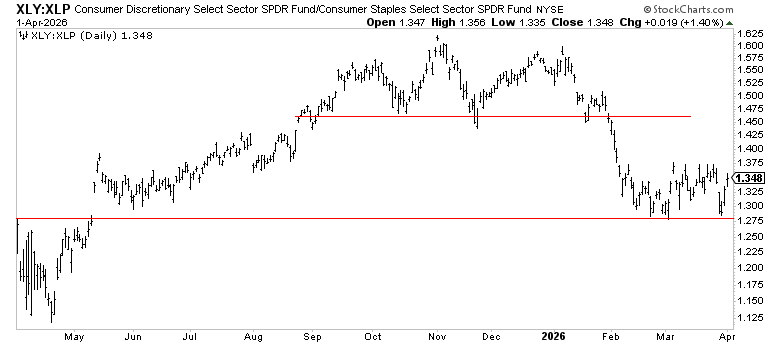
The other ratio worth watching: XLY:XLP (Consumer Discretionary vs Consumer Staples). This is a classic risk appetite gauge. The ratio hit a low of 1.29 in March and held right above the May 2025 support level of 1.24. That’s a key line. When consumers are pulling back hard enough to break that ratio below its prior cycle breakout point, you’re looking at a demand-driven downturn. It didn’t break. The ratio continues to find support on that level.
Where We Stand Technically
As of April 1, the S&P 500 sits at 6,575, sandwiched between support and a tight resistance cluster:
Short-Term Trend
8-day EMA (6,516): Short-term trend recaptured. Constructive.
21-day EMA (6,611): Immediate resistance. The index is testing this from below right now.
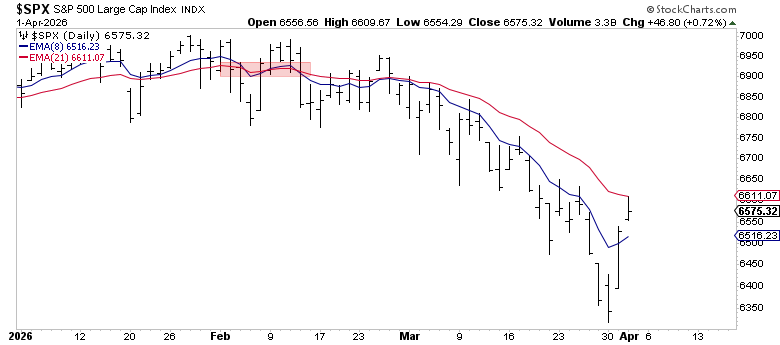
Prior to our end of March Rally, the S&P hit 22 consecutive days closing below its 8-day moving average, giving a heavy indication we were oversold and ready for a bounce.

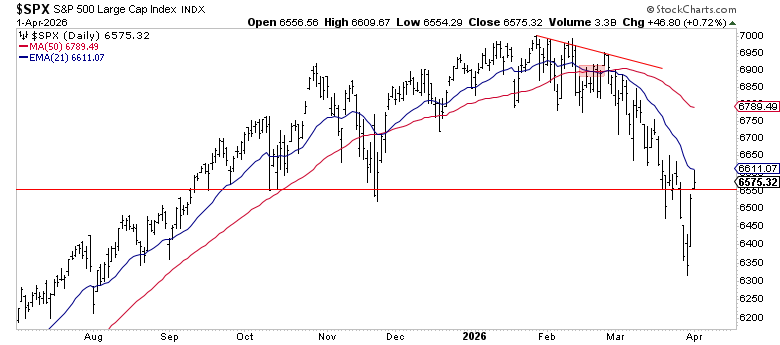
Intermediate Term Trend
The Momentum trend (the 21EMA and 50SMA) crossed negative in late-February and continues to decline. The S&P broke down past key support markets at $6,550 marking the October and November 2025 lows. Today’s rally regained that key level.
The Three Sectors That Can Decide This
Technology (XLK), Communication Services (XLC), and Consumer Discretionary (XLY) combine for roughly 50% of the S&P 500’s weight. They’re also the three biggest laggards this year — down 6.1%, 5.2%, and 7.9% respectively. The index doesn’t recover without them.
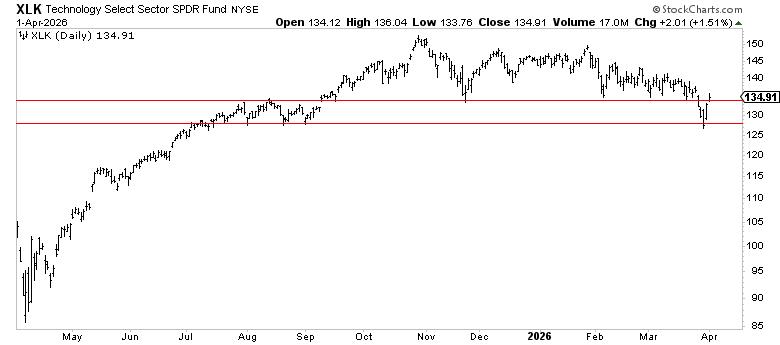
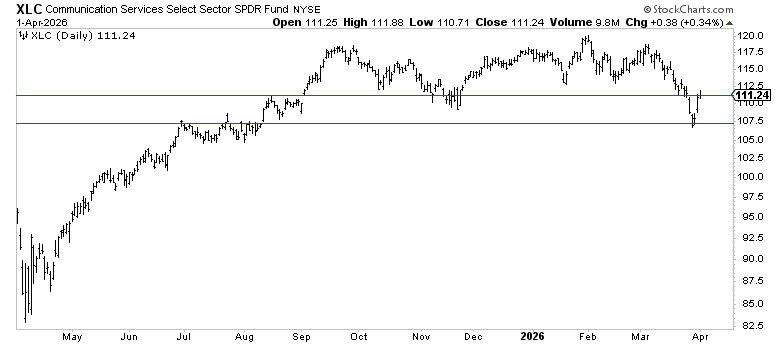
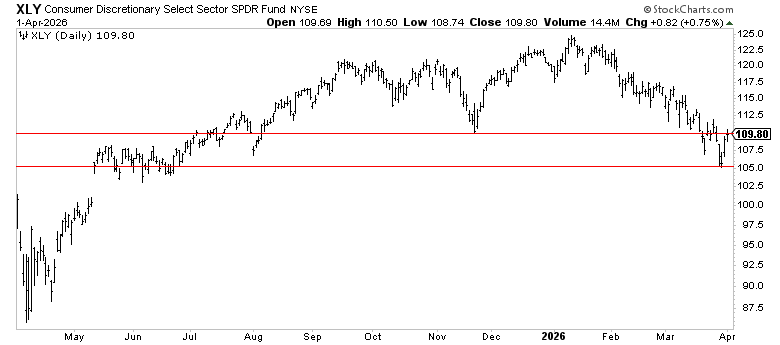
All three caught major support from prior 2025 consolidation. The bounces are there. What’s missing is conviction. Follow-through from these levels sustained buying, not a dead-cat bounce is what separates a correction from a trend change. If these three can build on these support lines and reclaim positive trends, the index likely follows. If they stall and roll over, defensive rotation alone likely can’t carry the market.
Small Caps: IWM Testing a Key Level
Small caps (IWM) dropped 5.8% in March and are now sitting right on their 21-day EMA at $249.59. The index briefly broke below its 200-day moving average on March 30 before bouncing back above it on April 1, a level that’s been support since November 2024.
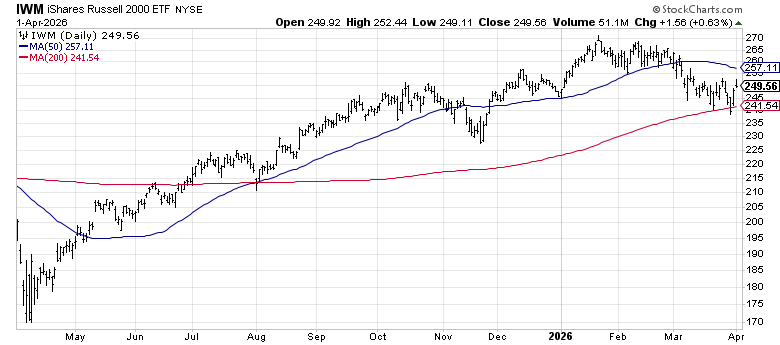
What’s worth noting: despite the March selloff, IWM is actually still positive on the year at +1.6%. Small caps have quietly held up better than the large-cap index on a YTD basis, even though they’re 7.3% off their January highs. The IWM:SPY ratio tells the relative story. It’s currently at 0.381 near the top of the 2025 range (0.345 - 0.382).
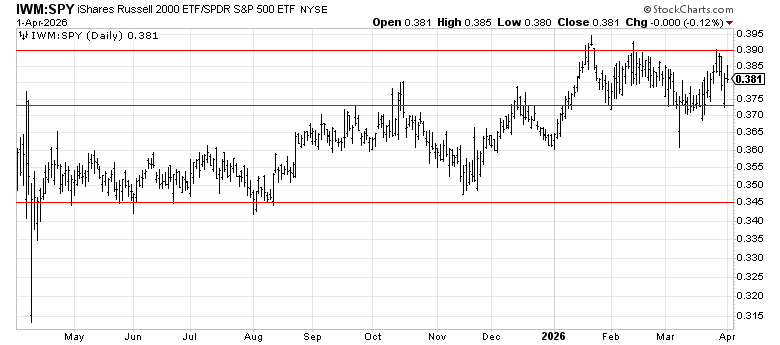
Small caps have been gaining ground against large caps since April 2025, when the ratio bottomed at 0.345. That trend of relative outperformance is still intact despite the March pullback. The level to watch: the 200-day moving average at $241.54. IWM just tested it and bounced. If it holds, the small cap rotation thesis is alive. If it breaks, it signals a risk-off environment that goes beyond just mega-cap weakness, and that’s a different conversation entirely.
Momentum: Stock-by-Stock
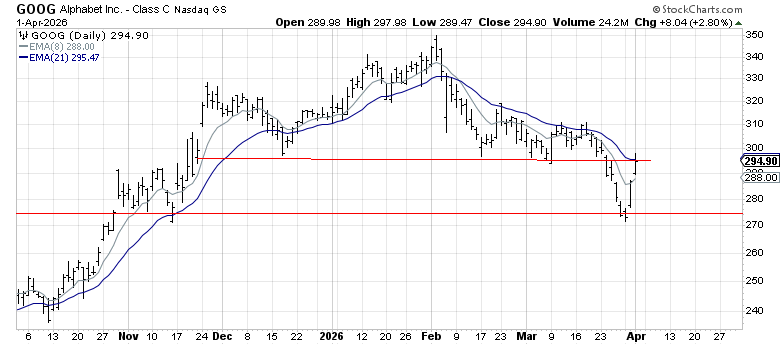
Alphabet (GOOG) — $294.90, YTD -6.0%
GOOG is trading below its 50-day ($310.71) but well above its 200-day ($264.58). It’s still showing stronger relative strength than most of the mega-cap complex , which is why our model is keeping it despite the drawdown. This is the name that benefits most if the XLC bounce develops conviction.
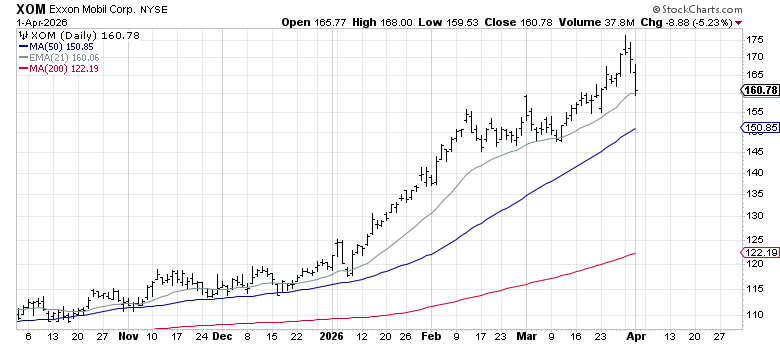
Exxon Mobil (XOM) — $160.79, YTD +34.5%
XOM is trading 31% above its 200-day moving average, firmly in an uptrend, and riding the oil move. March was +10% while the S&P fell 5.1%. In a market struggling for direction, XOM has been a relative strength standout.
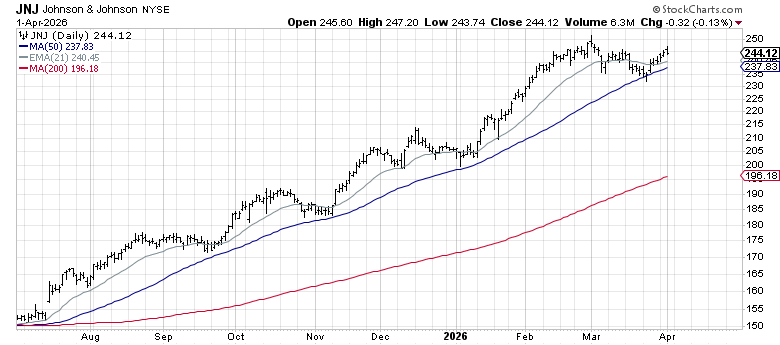
Johnson & Johnson (JNJ) — $244.12, YTD +18.6%
The defensive anchor. JNJ is trading 24% above its 200-day, above its 50-day, and near 52-week highs. In a quarter where the S&P fell 5%, JNJ delivered +18%. This negative correlation to a down trending market is exactly the type of momentum you look for.
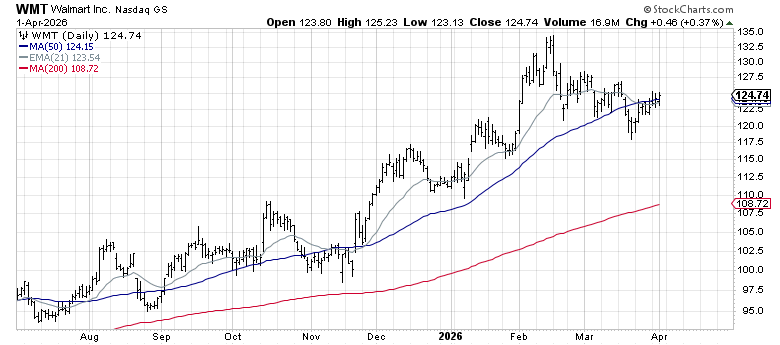
Walmart (WMT) — $124.74, YTD +12.2%
Another defensive compounder with current negative correlation to the index. WMT is above its 200-day and has held steady through the March volatility.
The Memory Trade: MU, WDC, CIEN
Our momentum model identified names that are all deep in the memory and infrastructure buildout theme. Three of them deserve special attention:
Western Digital (WDC) — $297.73, YTD +72.9%
WDC was flat in March — while the S&P fell 5%. It’s still trading in a strong uptrend. The memory shortage isn’t a Micron-only story. WDC’s NAND and HDD business is seeing a demand renaissance driven by enterprise storage build-outs for AI training data. The magnitude of this move, nearly a double year-to-date, reflects a fundamental re-rating, not a momentum chase.

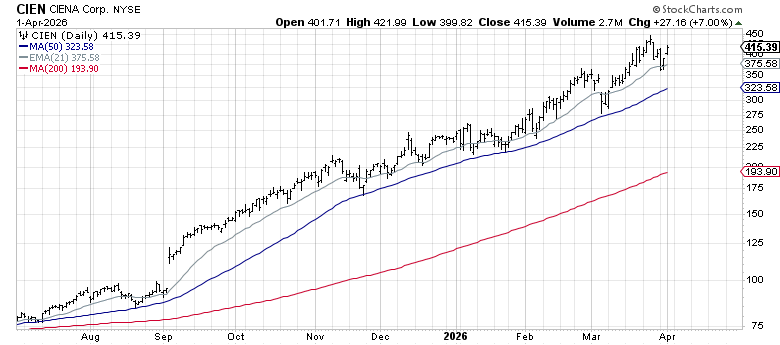
Ciena (CIEN) — $415.39, YTD +77.6%
CIEN was one of the strongest non-energy names in March, gaining almost 10% in a month where virtually everything else was down. Ciena makes the optical networking equipment that connects data centers - the physical plumbing of the AI buildout. As hyperscaler capex accelerates, the bandwidth demands between and within data centers are exploding. CIEN is the pure play on that thesis.
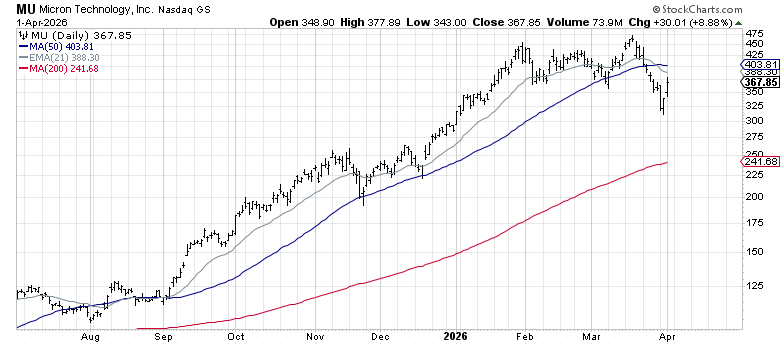
Micron Technology (MU) — $367.85, YTD +28.9%
Micron sits at the center of the memory trade as one of the most powerful themes in the market right now. The AI-driven shortage of high-bandwidth memory remains severe, with HBM sold out through year-end and pricing locked in. MU is trading 50% above its 200-day moving average. It pulled back quite a bit in March along with the broader tech complex, but the fundamental story hasn’t changed.
What We’re Watching in April
The immediate question is whether the S&P 500 can clear the 21 EMA / 200 SMA resistance zone at 6,610-6,640. A decisive close above that cluster would be consistent with the 78% historical base rate for recovery after a first cross below.
Beyond the index level, the signals that matter most:
XLK, XLC, XLY follow-through. The March bounces need to develop into sustained moves above their 21-day EMAs. Without that, the index is capped.
RSP holding the 200-day. If the equal-weight index loses its 200 SMA, the breadth picture deteriorates from “rotation” to “broad weakness.” That’s a different environment.
XLY:XLP holding the May 2025 low. A break below 1.24 on this ratio would signal consumer risk appetite is genuinely rolling over. It held in March. It needs to keep holding.
Oil. WTI at $99 is a tailwind for energy names but a headwind for margins and the consumer. A sustained break above $100 introduces a new variable into the inflation and earnings picture.
The 10-year. As long as yields stay below this key 4.3% range, the rate environment is manageable. Rising rates would put additional pressure on equity valuations.
The weight of the evidence — broad market holding its 200-day, risk appetite ratios and key sectors above prior cycle lows, treasury yields stabilizing — points toward the more benign resolution. But evidence can change, and we’ll be tracking it closely through April.