March 2026 Week 1
Crosscurrents, Cracks, and What the Data Says

The Big Picture
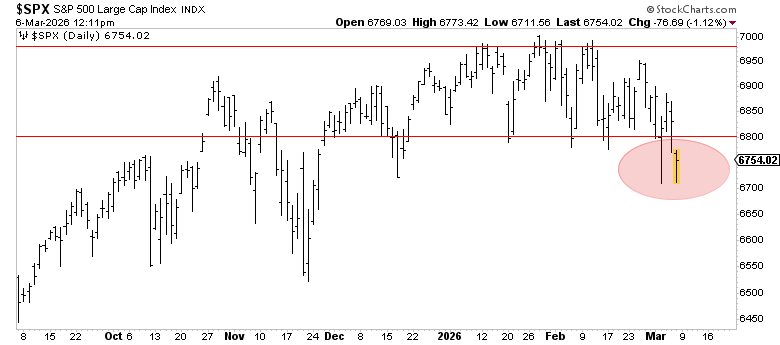
The S&P 500 has turned negative on the year. After five months of coiling between 6,800 and 7,000, the index decisively failed at 6,900 resistance and is now trading around 6,735 — below both its 50-day and 100-day moving averages for the first time since the April 2025 tariff shock. The all-time high of 7,002 (January 28) feels like a long time ago.
What changed? Three things hit simultaneously:
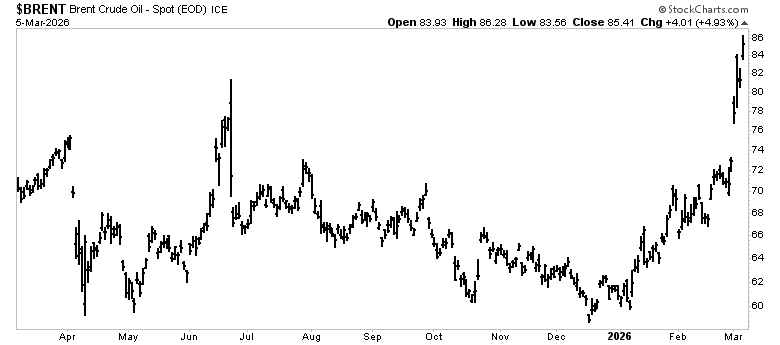
The Iran conflict — Joint US-Israeli strikes beginning February 28 effectively shut down the Strait of Hormuz. Brent crude broke above $90/bbl, up 26% in a week. The Strait handles ~20% of global oil supply. Insurance providers have pulled war-risk coverage for tanker transit — meaning commercial shipping can’t pass through even if it wanted to.
A shocking jobs report — February payrolls printed -92,000 (vs. +50,000 expected). Third negative print in five months. Unemployment ticked up to 4.4%. December was revised down by 65,000. Average unemployment duration hit 25.7 weeks — the longest since December 2021.
Sticky inflation + a boxed-in Fed — CPI at 2.4%, with the Fed’s preferred PCE gauge still near 3%. 10-year yields surging above 4.17%. The Fed is trapped: the labor market is weakening, but oil-driven inflation pressures are building. Rate cuts feel off the table. The January FOMC minutes even floated the possibility of raising rates. The word “stagflation” is back in circulation.
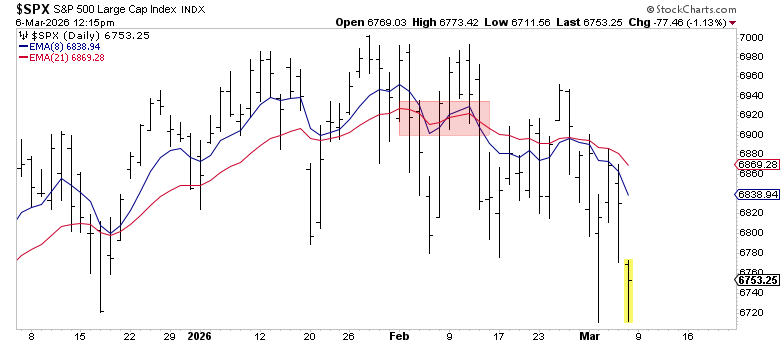
Short-Term Trend: 8 EMA / 21 EMA — Bearish
The short-term picture is clearly bearish. With the S&P 500 dropping from 6,900 to 6,735 in under two weeks, the 8-day EMA has crossed below the 21-day EMA — a short-term sell signal. Price action has been one-directional: lower highs, lower lows. The February chop saw seven crossings of the 50-day SMA alone — but this latest move has conviction behind it.
For those using the 8/21 EMA crossover as a tactical timing tool: the signal flipped bearish in late February and hasn’t looked back.
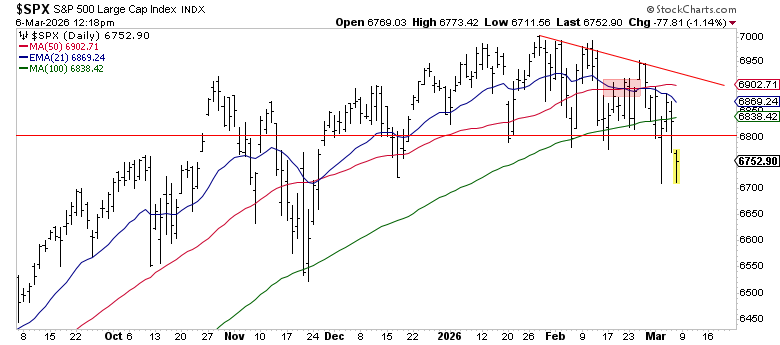
Intermediate-Term Trend: 21 EMA / 50 SMA — Bearish
The intermediate picture is where things get interesting. The S&P 500 broke below its 50-day SMA (~6,863) on February 27 and hasn’t reclaimed it. It then broke below the 100-day (~6,835) on March 5. The 21-day EMA has rolled over and crossed below the 50-day SMA — confirming the intermediate trend has turned bearish.
This is the transition zone. With the 21 EMA now below the 50 SMA, the intermediate trend has joined the short-term in bearish territory. The only thing left holding is the long-term 200-day.
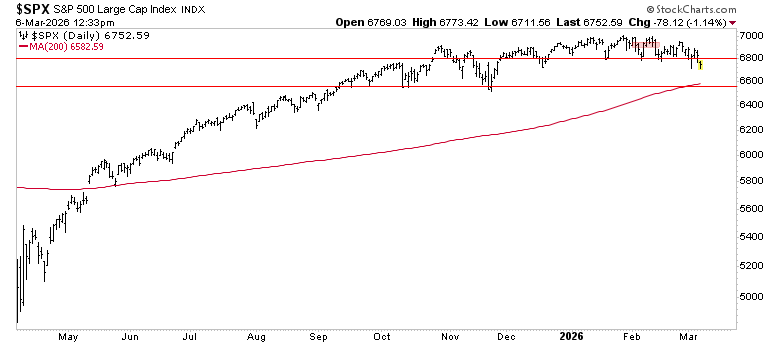
The 200-Day: Line in the Sand
The 200-day SMA sits around 6,580-6,612. That’s roughly 2% below current levels. As long as the S&P holds above it, the long-term uptrend remains technically intact.
Key support levels to watch on the way down:
6,800 — critical near-term support, “risk-off” trigger
6,580 — 200-day SMA, the big one
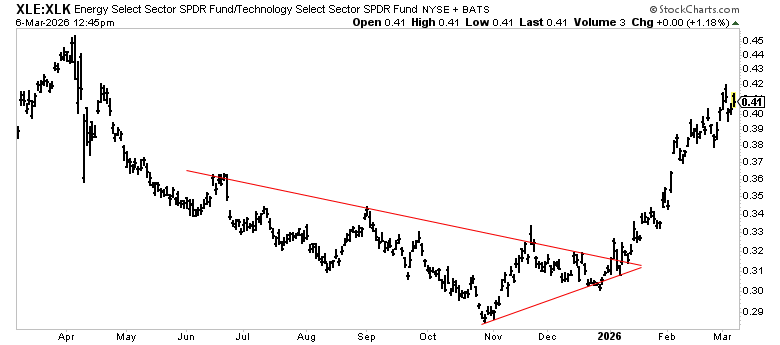
The Great Rotation: Bits to Atoms
The biggest story of 2026 isn’t the Iran war or the jobs miss — it’s the sector rotation that was already underway before either happened.
Returns since the October 29 market high:
Sector Returns Since Oct 29 High
Energy +30%
Materials +17.5%
Staples +13%
Industrials +12%
Real Estate +8.4%
Health Care +8%
Utilities +5.5%
Communications +2.8%
Financials -0.7%
Discretionary -1.75%
Technology -7.08%
Capital is flowing from software multiples into tangible assets — oil, defense, metals, infrastructure. The Iran conflict poured gasoline on a fire that was already burning.
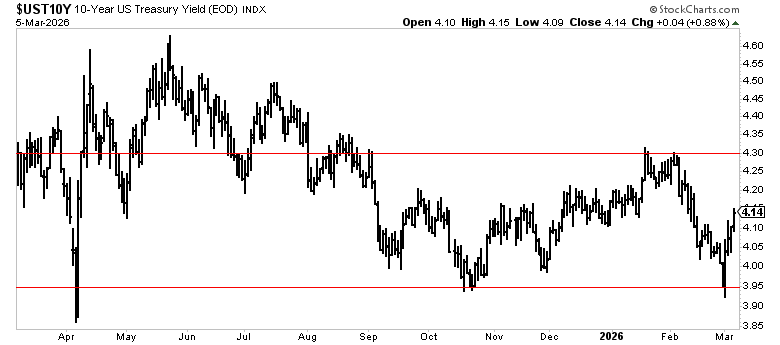
Yields & The Bond Market: No Safe Haven
The 10-year Treasury yield surged above 4.17% this week — its highest level since mid-February — and the move tells you everything about where this market’s head is at.
In a normal geopolitical crisis, bonds rally. Investors flee to safety, yields drop. That’s not happening. Instead, yields are rising into a war because the inflationary implications of $90 oil are overpowering the flight-to-quality instinct.
10-Year Yield: 4.17%, up sharply from below 4.00% in late February
2-10 Spread: Widened to 57 basis points — the curve is steepening, signaling rising inflation expectations
Rate cut expectations: Markets now pricing one to two 25bp cuts for 2026, with July as the earliest likely window
The bond market is telling you it doesn’t think the Fed can rescue this.
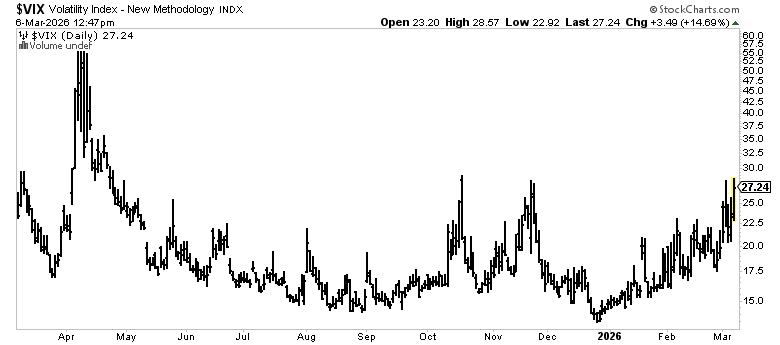
Volatility and Sentiment
VIX: 23-28 range. Elevated, rising, but not panicked. A push toward 30 is possible if the 200-day SMA breaks.
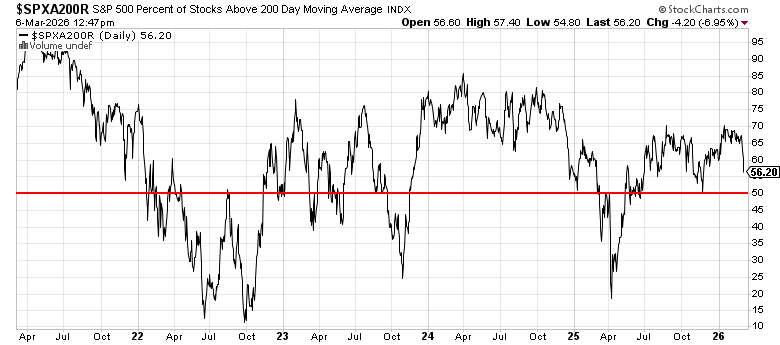
Breadth: Deteriorating. Only 56% of S&P 500 stocks above their 200-day MA. The advance/decline line is trending down even as the index stays relatively close to highs. Narrow leadership is a warning sign.