

The Anatomy of a Market Collapse
A Historical Look at How Trends Precede Major Declines

Aside from our regularly scheduled Shield & Sword posts, we wanted to take a second to review what we call ‘the anatomy of a collapse’.
Most investors think market crashes happen overnight. They don’t.
The reality? Major declines follow a predictable pattern—what we call “The Anatomy of a Collapse.”
It’s simple:
The trend breaks
Price dips below the Red Line
The bulk of the decline occurs BELOW the Red Line
Historically, the trend precedes stock market crashes.
Let’s look at every major decline in history to see if this holds true.
The Great Depression 1929 - 1932
The Decline | -85%+ from peak to trough - the worst in history
The Timeline | Almost 3 years
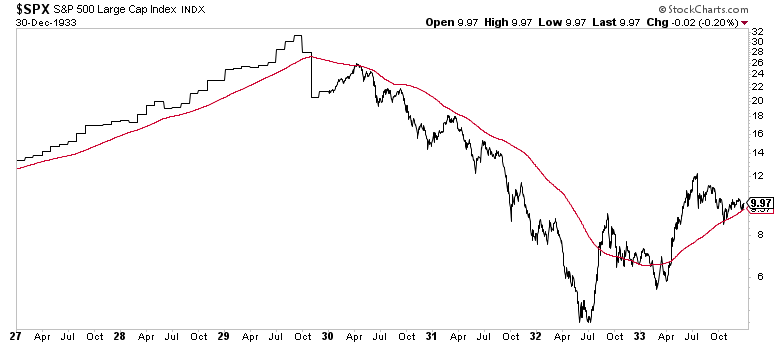
Notice how this crisis doesn’t happen in days or weeks—it unfolds over years.
The Red Line crossed negative in November 1929. The majority of the decline occurred AFTER that signal.
A ‘passive investor’ willingly chooses to bleed through these declines... but a recession of this degree will ‘never happen again,’ right?
The WWII Decline 1937 - 1943
The Decline | -60% over 5 years
Often overshadowed by the Great Depression, but still one of the most devasting declines in history.
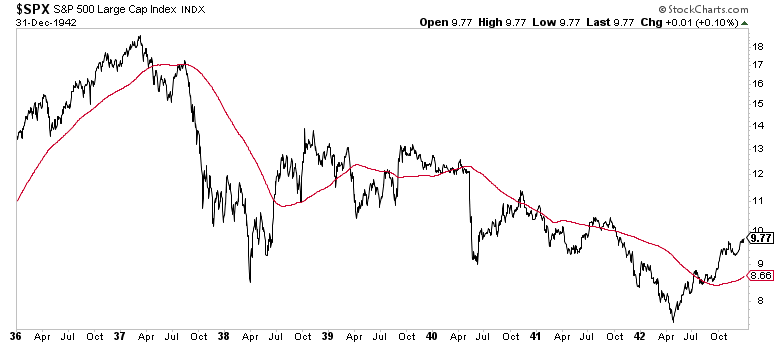
Again, look at the Red Line as a measure of hypothetical entry and exit points. Is it perfect? Of course not. But the fact stands - Historically, the trend precedes the large part of the decline.
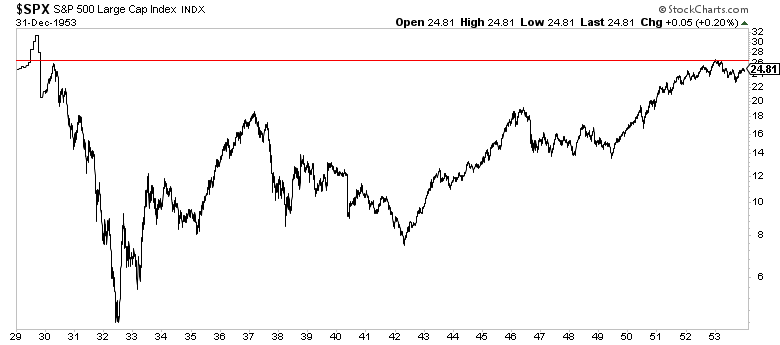
Both of these declines occurred back-to-back. It would have taken the ‘passive investor’ 25 years just to break even (1929-1954).
The 70’s Disaster
The Result: Net 0% return over 6 years
Two Major Declines:
1969-1970: -35%
1973-1975: -45%
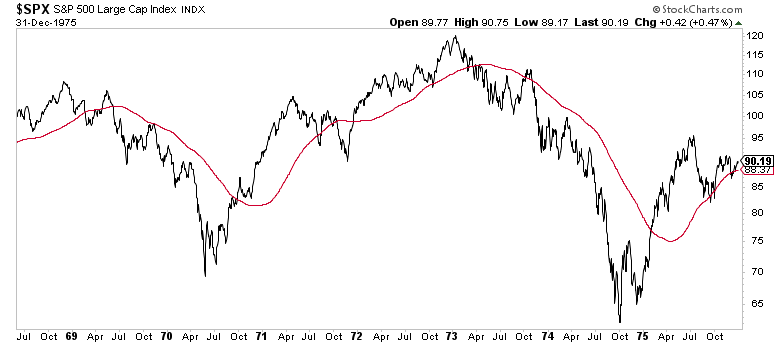
Between monetary policy, stagflation, and the oil crisis, it was a decade of booms and busts that led nowhere.
Could trend-following have helped navigate these declines? Historical data suggests yes.
Why? Historically, trend breaks have preceded stock market crashes.
1987 ‘Black Monday’
The Decline: ~33% total, ~28% occurred in just 5 days
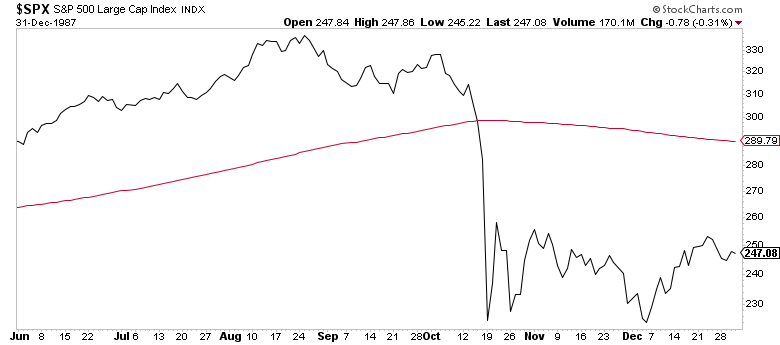
In fairness, the Red Line didn’t help much here—the crash was too quick.
The difference between a ‘Crash’ and a ‘Decline’ is the speed at which it occurs.
Black Monday was a true crash. Most bear markets are declines—slow, grinding, painful.
2000’s Dot.com Bubble
The Decline: -40%+ over nearly 3 years
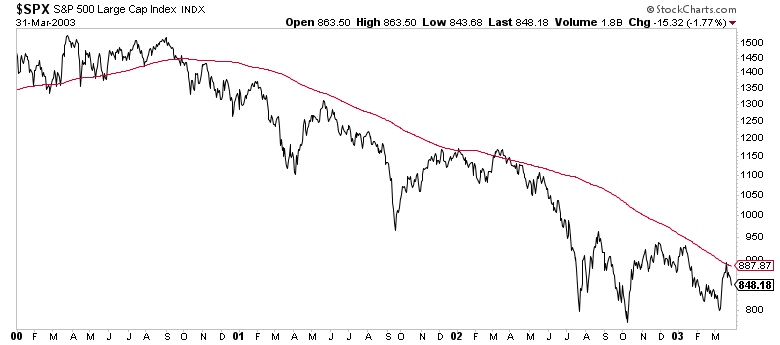
Do we sound like a broken record yet?
Practically all of the decline occurred below the Red Line.
2008 Financial Crisis
The Decline: -50%+ in less than 2 years
The most devastating decline since the WWII Downturn.
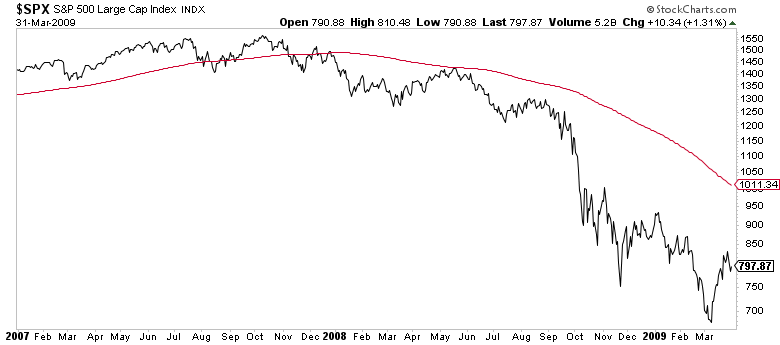
Almost 20 years ago but feels like yesterday for a lot of people.
Just take a look at that Red Line.
The Anatomy of a Collapse.
2020 COVID Crash
The Decline: -34% in 3 weeks
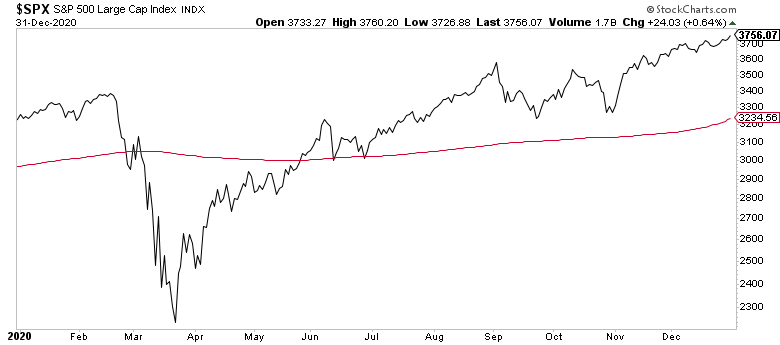
Look at the COVID Crisis. Reducing risk at the Red Line could have helped you avoid a big chunk of that 34% decline.
Now look at May 2020 when the price came back ABOVE the Red Line.
Were you optimistic on the outlook of the economy in May 2020? Of course not.
But the Red Line signal turned positive.
2022 Rate Hike Cycle & Inflation
The Decline: -27% from January to October 2022
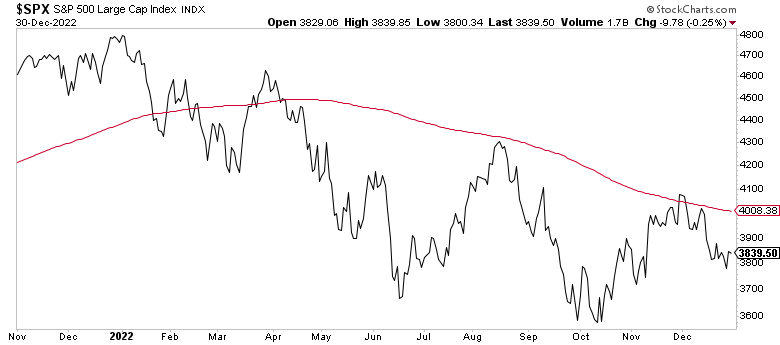
The Red Line endured a 10% decline in January, a brief fake-out in April, and proceeded to miss the bulk of the decline.
The passive investor? Down 27% and white knuckling through every headline about inflation.
2023 The Recession that Never Came
Just kidding.
While headlines screamed ‘RECESSION,’ the S&P rose 26%.
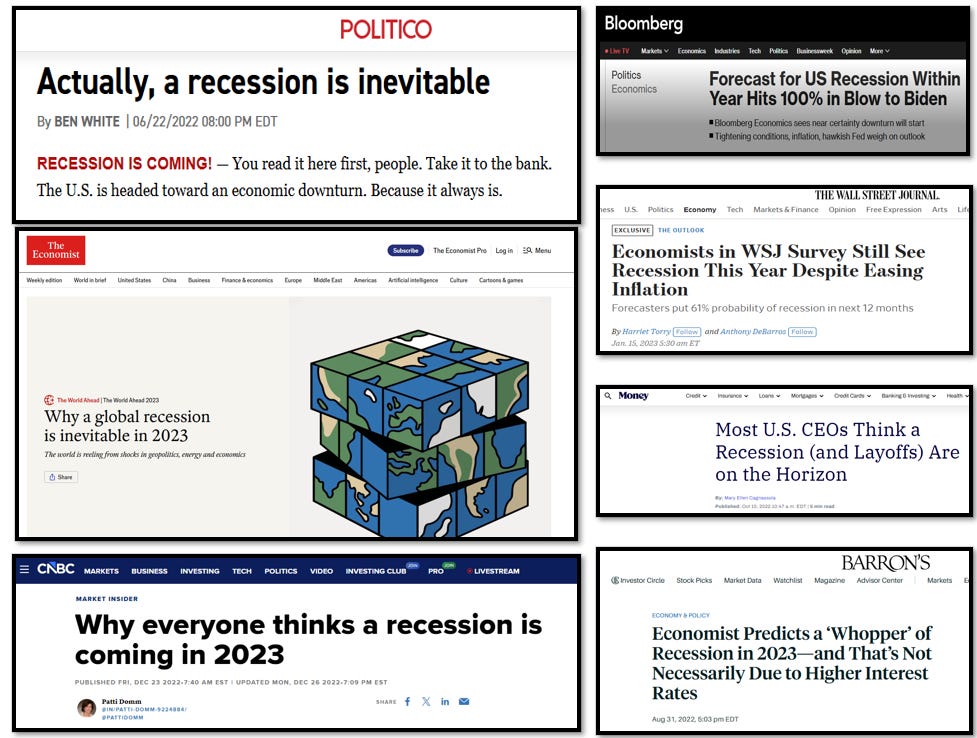
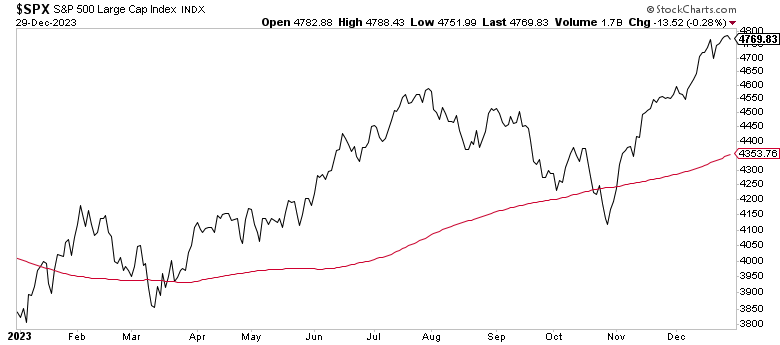
This illustrates the value of objective signals over subjective news headlines.
The Pattern is Clear
Across nearly 100 years of market history, the same pattern typically repeats:
✅ Trend breaks
✅ Price crosses below the Red Line
✅ The majority of the decline happens BELOW the Red Line
This isn’t hindsight bias. This is a basic, time-tested indicator in technical analysis.
The 200-day moving average has been used by institutions for decades precisely because, a lot of the time, it works.
The Passive Investor’s Choice
You have two options:
Option 1: Hope
Hope the next crash won’t be as bad
Hope you can stomach a -50% decline
Hope you don’t panic and sell at the bottom
Hope it recovers quickly
Option 2: A Plan
Use objective signals to manage risk
Step aside when the trend breaks
Re-enter when the trend recovers
Remove emotion from the equation
What This Means for You
Understanding the anatomy of a collapse doesn’t mean you can predict the future.
It means you can have a plan for managing it.
The Red Line isn’t magic. It’s a simple, objective measure of trend. When the majority of stocks are in uptrends, the Red Line acts as support. When they’re not, it becomes resistance.
And historically—across every major decline in the last century—the bulk of the damage happens below that line.
Want to see how we apply this in real-time?
Our paid Shield & Sword research provides:
✅ Monthly Red Line signal (positive or negative)
✅ Weekly trend updates
✅ Market regime analysis (momentum, breadth, rotation)
✅ Top 5 momentum stocks when signals are positive
✅ Hypothetical model portfolio framework
Questions or thoughts? Drop them in the comments below.