


🛡️The Shield Report
Weekly Market Monitor & Risk Analysis
Current Market Status: 🟢 Positive
The signals are favorable. The market trend is pointing up, making this a high-probability environment to be invested.
The Month-End Shield signal is the primary signal that we use to dictate our Hypothetical Model Portfolio
Paid members can access this below to see actionable ideas on how you could invest with the trend.
Not a paid subscriber yet? Start your Free Trial
🛡️The Red Line | Long-Term Trend Review
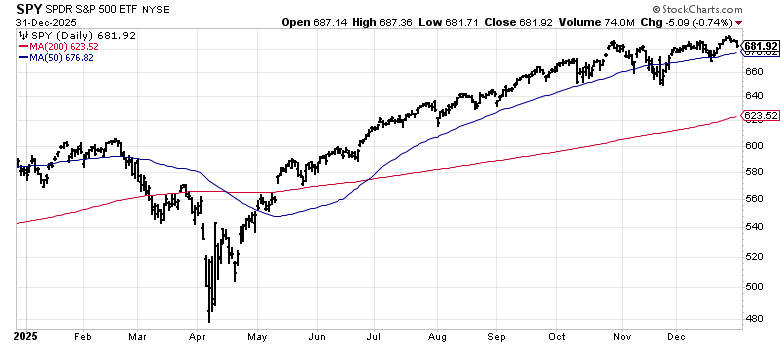
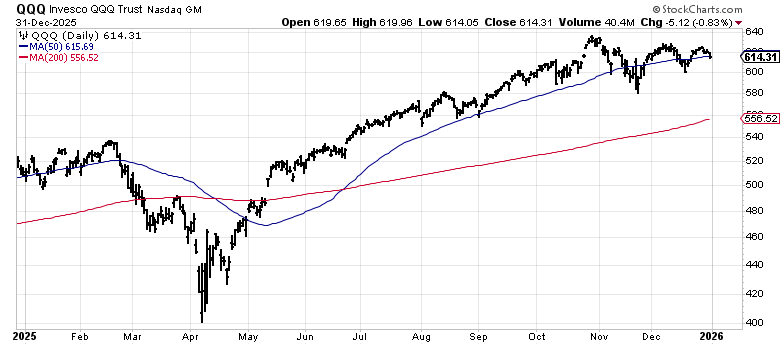
We define risk using one primary metric: The Red Line (the 200-day moving average).
The Signal: If the price is Above the Red Line, we play offense (Buy/Hold). If it falls Below the Red Line, we play defense (Sell/Protect).
The Verdict: Both the S&P 500 (SPY) and the Nasdaq 100 (QQQ) are currently trading Above the Red Line ✅.
S&P 500 SPY 0.00%↑
Status: Positive Long-Term Trend ✅
Nasdaq 100 QQQ 0.00%↑
Status: Positive Long-Term Trend ✅
🛡️Momentum Trend Review (The Speedometer)
Think of this as the “speed” of the market. It measures the strength behind the price.
We track a faster-moving moving averages to track the market momentum.
Positive Momentum: When the Gray Line is above the Blue Line, the market has positive momentum.
Neutral/Lagging Momentum: When the Gray Line is below the Blue Line, the market has negative / neutral momentum.
S&P 500 SPY 0.00%↑
Status: Positive Momentum Trend ✅
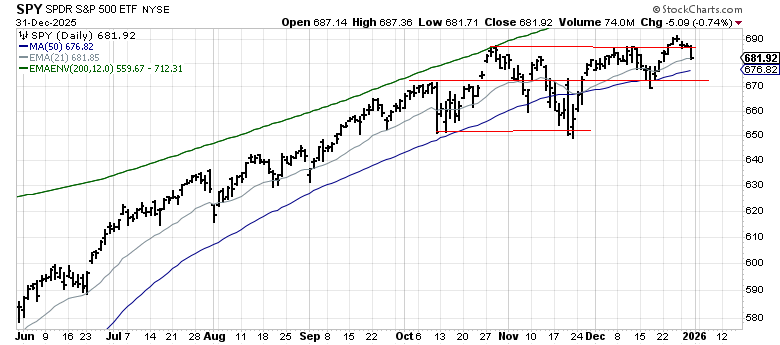
Analysis: After testing resistance in late November, the index pulled back below the 50-day Moving Average (Red Line). We are now seeing a “Higher Low” form—a classic bullish structure. As long as price stays above $672, and the 21EMA above the 50SMA, the trend is healthy.
Nasdaq 100 QQQ 0.00%↑
Status: Positive Momentum Trend ✅
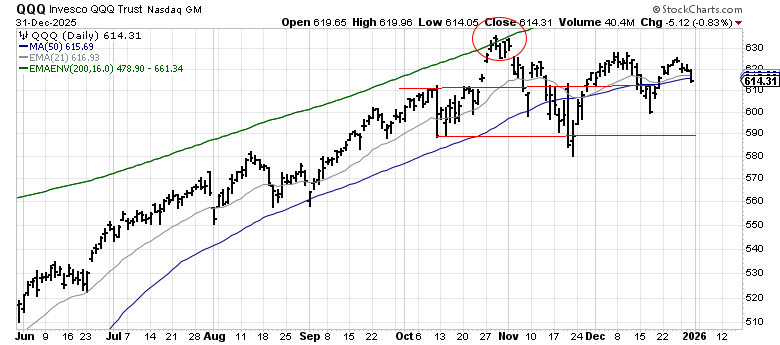
Analysis: Tech showed weakness in November but found support near the October lows ($590). Momentum has reset. We are watching for the rally to continue above the $625 resistance line to confirm the next leg higher.
🧠 Sentiment & Themes
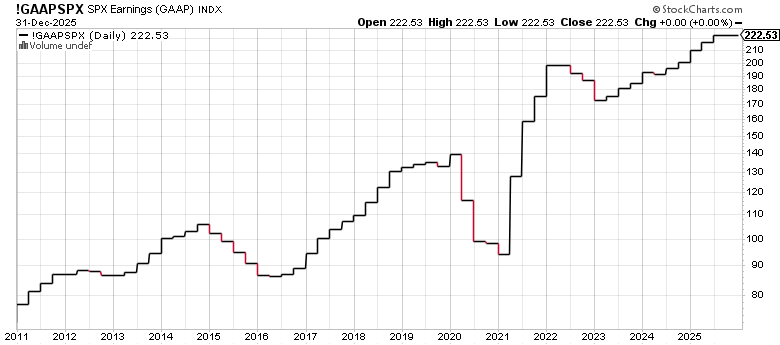
The Fundamental Floor: Earnings Growth
While we trade on price, we respect the fundamentals. S&P 500 earnings have remained resilient and growing throughout the year, defying recession predictions.
Verdict: Constructive. stock prices tend to follow corporate profits. The fact that earnings are expanding validates this rally—it suggests this is not just a speculative bubble, but an uptrend supported by real cash flow.
Sector Spotlight: Semiconductors (SMH)
Semiconductors are currently a “mixed bag,” but the internal rotation is bullish.
The Divergence: While mega-cap giants like Broadcom AVGO 0.00%↑ and Nvidia NVDA 0.00%↑ are still attempting to rally off support, new leadership has emerged in names like Micron MU 0.00%↑ and Lam Research LRCX 0.00%↑ , which are coming off of new highs.
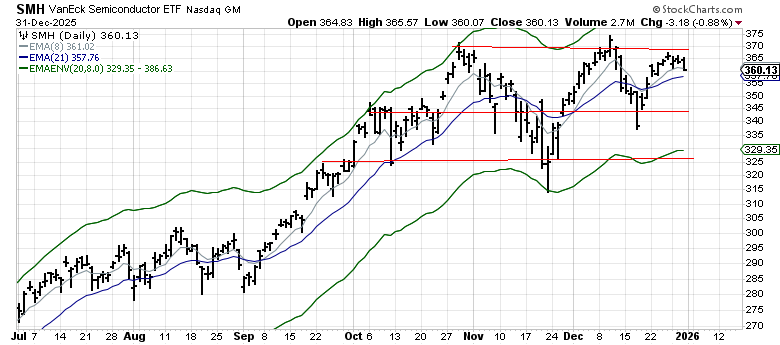
Technical View: The recent pullback in the Semiconductor ETF SMH 0.00%↑ appears to have been a temporary lull rather than a trend change. The group is cycling higher again, and we are watching for the trend to continue into a decisive breakout above $370 resistance to confirm the next leg up.
The M5 Power Rankings December 2025
T5. J.P. Morgan
T5. LOCKED
4. LOCKED
3. LOCKED
2. LOCKED
1. LOCKED
Want the rest of the list?
You’ve seen the Momentum Signal and our Bonus Pick (JPM). But the M5 Strategy flagged 5 other high-momentum setups heading into January that are moving right now.
Unlock the full M5 Power Rankings instantly and get:
✅ The Top 2 Healthcare Breakouts (Rotational plays).
✅ The Top 3 Mega-Cap Tech Leaders (Trend continuation).
✅ Weekly Updates & Trends for every ticker.
See the full list free for 7 days.
Disclosures
Momentum Wealth Research LLC (“The Publisher”) is an independent publisher of financial information. All content provided is for informational and educational purposes only and does not constitute personalized or specific investment advice. Momentum Wealth Research LLC is an affiliate of Momentum Wealth Planning, LLC (“The RIA”) and are separate legal entities.
Your subscription does not create a fiduciary, client, or professional relationship with The Publisher or The RIA. All investment strategies, including the “Shield & Sword” system, involve a significant risk of loss. Past performance is no guarantee of future results. Model portfolios are purely conceptual and do not represent the performance of actual trading activity. Readers are encouraged to independently evaluate all investments and consult with a professional advisor before taking action.
Please see our full Terms of Service & Privacy Policy